LLM Price Volatility
What a million tokens cost, tracked until the line stops falling.
Did you like it?
Why it ended. Not enough engagement. The chart was cheap to keep and nobody visibly cited it; the studio would rather write the essay than maintain the reference.
- What it does
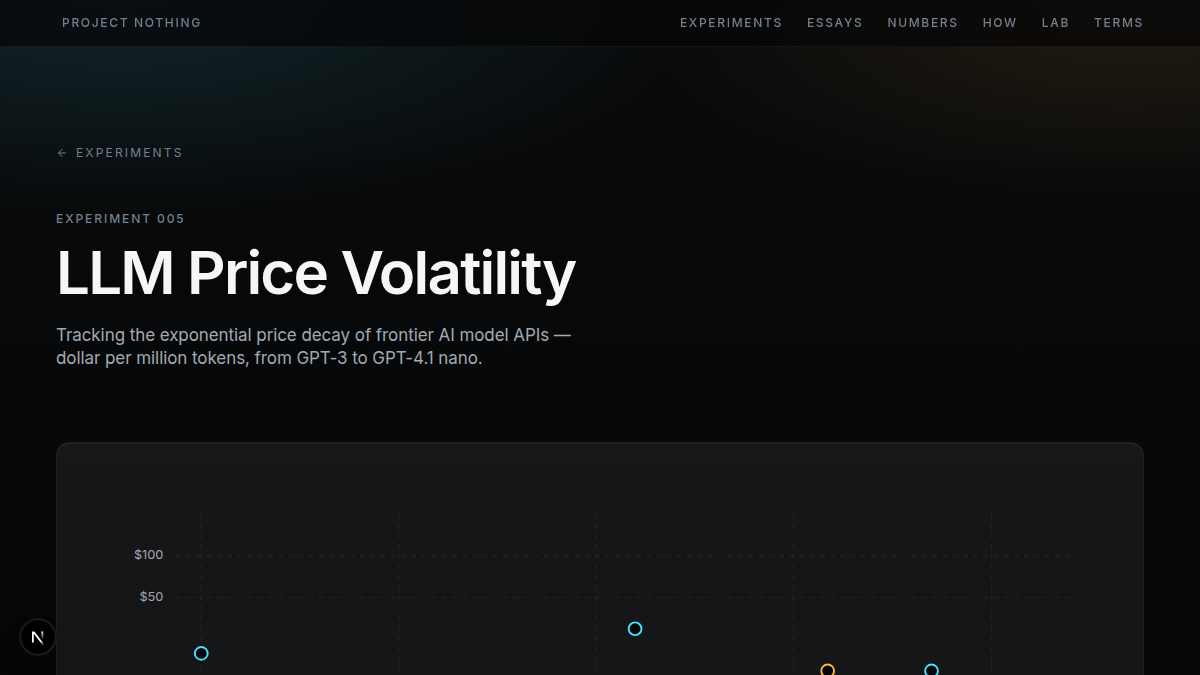
- The price of a million tokens across frontier models, charted since 2021 on a log scale and updated weekly.
- Who it is for
- For anyone budgeting for AI, or betting on where the price goes.
Notes from the making (2)
- launched — historical $/1M token chart
- returned to nothing — not enough engagement
This page stays up whatever happens to the experiment. The record it is drawn from is public: /api/nothing/experiments.